Business Analytics in Cambridge, MA
Business Analytics in Cambridge, MA
We help organizations turn scattered business data into structured analytics workflows. Business analytics in Cambridge, from strategy through dashboards and team training, so leadership decisions rest on trusted, well engineered data systems.
Let's build together.
Talk with a senior engineer about your product idea, architecture, and what it would take to build it.
90+
Active Client Partnerships
80+ Person
Product & Engineering Team
100%
Your Code & IP Ownership
U.S.-Led
Delivery & Accountability
Services we offer
- 01Business Analytics
> Turning Data into Decisions <
Business analytics is the practical use of data analysis, reporting, and modelling to answer real business questions. What is driving churn? Which product lines carry the highest margin? Where are operational bottlenecks costing the most time? Typical problems include fragmented reporting, unclear key performance indicators, and slow manual analysis trapped in spreadsheets. Cambridge companies operating across many tools, teams, and historical systems often find that no single person holds a complete view of business data. SoftDoes designs metrics frameworks, reporting layers, and insight workflows that fit each client's context, converting unstructured data and raw data into data into actionable insights. Cambridge attracts top tier international conferences year round, and the local ecosystem allows for applying analytics to specialized sectors. That concentration of expertise means companies here expect more from their analytics partners, and rightly so.
> FOCUSED ANALYTICS THAT ANSWER REAL QUESTIONS <
SoftDoes does not chase every data source. We concentrate on analytics that remove uncertainty in the decisions that matter most. If a metric does not connect to a business goal, it does not belong on the dashboard. We convert messy records into clear, consistent views that executives and teams actually trust. That means defining metrics, documenting calculations, and maintaining one version of truth across reports. Data quality enforcement is continuous, not a one time cleanup. Practical outputs include dashboards, automated reports, and alerting for important thresholds. When a number moves outside expected range, the right people know immediately. Every engagement starts with turning complex data into something a business user can read in seconds.
- Clear KPI definitions
- Trusted data sources
- Faster reporting cycles
- Insight ready dashboards
- Aligned decision workflows
> DECISIONS POWERED BY CAMBRIDGE DATA <
What would change if every major decision in your Cambridge office started with the same trusted numbers? Leaders can compare scenarios, check data trends against historical data, and quantify impact before committing to a direction. Scenario ready dashboards replace opinion based debates with evidence based discussions. This approach reduces risk, supports cost savings, and uncovers opportunities that were hidden in disconnected spreadsheets. Consistent decision support creates long term confidence in investing, hiring, and product changes. When the same trusted data informs every planning cycle, organizations stop second guessing and start moving.
- Scenario ready dashboards
- Shared decision context
- Reduced reporting effort
- Traceable KPI history
- 02IT Consulting
> SYSTEMS THAT SERVE YOUR DATA <
Strong IT consulting in Cambridge needs to be anchored in data, not only architecture diagrams. SoftDoes IT experts review systems, integrations, and cloud setups through the lens of analytics, performance, and reliability. This helps companies choose platforms, refine integration patterns, and plan migrations based on real usage data and business priorities. Cambridge teams benefit from a partner who understands both engineering detail and the analytics needs that sit on top of infrastructure decisions.
- System assessments
- Integration mapping
- Cloud planning
- Performance tuning
- 03Digital Transformation
> CHANGE YOU CAN MEASURE <
Digital transformation means nothing if you cannot observe the results. SoftDoes helps Cambridge companies reorganize processes, applications, and data flows so that every change is visible in key metrics. Data analytics and business intelligence tools track adoption, efficiency, and customer impact during transformation programs. Each step is guided by evidence, not assumption. Data driven strategies replace vague modernization goals with observable improvements.
- Process mapping
- Data informed roadmaps
- Platform modernization
- Insight driven adoption
- 04Product Management & Product Ownership
> PRODUCTS SHAPED BY EVIDENCE <
SoftDoes supports product leaders with data informed decision making across research, planning, and delivery. We work as external product owners or advisors who read analytics, customer feedback, and experiments before defining priorities. A Cambridge product team reviewing both usage data and support tickets might discover that a rarely used feature generates most of the support burden. That single insight can reshape an entire quarter's roadmap. Data driven decisions at the product level reduce rework and align bets with real signals.
- Evidence based roadmaps
- Feature impact tracking
- Experiment design
- KPI alignment
- 05Database Design & Development
> STRUCTURES THAT SUPPORT INSIGHT <
Clean, well designed databases are essential for any serious analytics effort. SoftDoes designs schemas, indexing strategies, and query patterns that support both transactional use and reporting needs. We normalize or denormalize data where appropriate, focusing on predictable performance for analytics queries. This reduces the time analysts spend fixing broken joins and inconsistent values, freeing them to focus on generating valuable insights and exploring data across the organization.
- Schema design
- Performance tuning
- Data quality enforcement
- Analytics ready structures
- 06Code Audits
> QUALITY YOU CAN QUANTIFY <
Code quality reviews become more objective when connected to analytics such as error rates, latency, and resource usage. SoftDoes conducts code audits that combine static analysis, runtime metrics, and architecture review to surface concrete risks. Outcomes include prioritized refactoring plans, security findings, and recommendations for monitoring that feed back into business intelligence tools. Cambridge teams use these audits to reduce incidents, improve reliability, and protect mission critical analytics workloads.
- Performance profiling
- Reliability review
- Data path tracing
- Observability gaps
> Turning Data into Decisions <
Business analytics is the practical use of data analysis, reporting, and modelling to answer real business questions. What is driving churn? Which product lines carry the highest margin? Where are operational bottlenecks costing the most time? Typical problems include fragmented reporting, unclear key performance indicators, and slow manual analysis trapped in spreadsheets. Cambridge companies operating across many tools, teams, and historical systems often find that no single person holds a complete view of business data. SoftDoes designs metrics frameworks, reporting layers, and insight workflows that fit each client's context, converting unstructured data and raw data into data into actionable insights. Cambridge attracts top tier international conferences year round, and the local ecosystem allows for applying analytics to specialized sectors. That concentration of expertise means companies here expect more from their analytics partners, and rightly so.
> FOCUSED ANALYTICS THAT ANSWER REAL QUESTIONS <
SoftDoes does not chase every data source. We concentrate on analytics that remove uncertainty in the decisions that matter most. If a metric does not connect to a business goal, it does not belong on the dashboard. We convert messy records into clear, consistent views that executives and teams actually trust. That means defining metrics, documenting calculations, and maintaining one version of truth across reports. Data quality enforcement is continuous, not a one time cleanup. Practical outputs include dashboards, automated reports, and alerting for important thresholds. When a number moves outside expected range, the right people know immediately. Every engagement starts with turning complex data into something a business user can read in seconds.
- Clear KPI definitions
- Trusted data sources
- Faster reporting cycles
- Insight ready dashboards
- Aligned decision workflows
> DECISIONS POWERED BY CAMBRIDGE DATA <
What would change if every major decision in your Cambridge office started with the same trusted numbers? Leaders can compare scenarios, check data trends against historical data, and quantify impact before committing to a direction. Scenario ready dashboards replace opinion based debates with evidence based discussions. This approach reduces risk, supports cost savings, and uncovers opportunities that were hidden in disconnected spreadsheets. Consistent decision support creates long term confidence in investing, hiring, and product changes. When the same trusted data informs every planning cycle, organizations stop second guessing and start moving.
- Scenario ready dashboards
- Shared decision context
- Reduced reporting effort
- Traceable KPI history

PRODUCTS BUILT ACROSS INDUSTRIES
Finance
Risk monitoring, revenue tracking, and regulatory reporting require near real time analytics. Finance organizations use data analytics to detect anomalies, support forecasting with historical data, and ensure ledger accuracy.
Healthcare
Capacity management, patient outcomes, and operational efficiency rely on consistent data processing. Combining patient flow records, scheduling, and resource usage uncovers cost savings and service improvements.
Education
Enrolment trends, learner engagement, and program outcomes are central questions for educational organizations. SoftDoes helps combine learning platform data, attendance information, and feedback into unified analytics views.
Construction
Project timelines, budgets, and resource allocation benefit directly from business analytics. SoftDoes integrates data from project management tools, procurement systems, and on site reports into business intelligence dashboards.
Technology
Technology companies generate significant product usage and telemetry data that can power deep analytics. SoftDoes helps teams use this data for product decisions, incident analysis, and customer experience improvements.
Startups
Survival depends on clarity. Startups use business analytics to prioritize efforts, track traction, and report progress. SoftDoes supports them with reliable, scalable data setups.
Compliance
Organizations facing strict rules depend on analytics to evidence compliance and monitor controls continuously. SoftDoes configures data pipelines, logs, and business intelligence reports that surface exceptions quickly.
Energy
Demand forecasting, asset performance, and operational efficiency are core analytical needs. SoftDoes works with sensor data, market information, and operational logs to construct insight ready datasets.


Transparency at each stage
Discovery & Alignment
We audit your infrastructure and goals to find technical debt and create a clear, scalable transformation roadmap.
Technical Strategy
Senior engineers select optimal stacks and patterns, ensuring architectural reasoning for long-term scalability.
Iterative Development
Step-by-step solution detailing with regular demos of diagrams and docs to track every milestone as it happens.
Careful Validation
We conduct risk assessments and compliance audits to ensure the stability and viability of the future system.
Implementation Support
Full architectural oversight and team support during rollout to ensure precise execution of the designed vision.
SoftDoes partners remotely to improve business analytics focused on outcomes
A short discussion can surface quick wins in business analytics, data analysis, and business intelligence tools. Reach out for an assessment focused on your own decisions, your own data, and the specific outcomes that matter to your organization.

Numbers Don’t Lie
Recent projects showcasing how we design, engineer, and deliver production-ready software solutions.

- Startup
- Real Estate
Our Haus AI
A finance professional turned founder built Our Haus AI, an AI-powered collaborative workspace where homeowners and contractors scope, bid, contract, and document renovation projects together. SoftDoes took her prototype and made it production-ready.- 10XMVP scope delivered
- 2+years Ongoing partnership
- 1Fully owned Platform

- Finance
- Energy
Deepwater Insights
Deepwater Insights delivers proprietary alternative data and niche research on the offshore drilling and energy sector to institutional investors, family offices, and high-net-worth individuals who require coverage that larger firms don't provide.- 100%Brand Continuity
- 2Platform Distribution
- 100%Paywall-Ready Content

- Real Estate
The building buyer
The Building Buyer is a Florida-based real estate investment firm co-founded by Dylan Troiano and Charles Hanlin. They acquire single-family, multifamily, and commercial properties across South Florida and beyond, with a focus on motivated seller opportunities.- 18Weekly hours saved
- 2+Years Ongoing partnership
- 1Fully owned Platform

- Education
- Non-Profit
WOVEN & NICE
Woven is a Spring Valley, NY nonprofit running the NICE program (New Training Inclusive Community Environment) in four Rockland County schools. Their team supports students through restorative practices, mediation, and professional development for teachers and administrators.- 4Schools Served
- 4Weeks to Launch
- 1STTime on Upwork

- Healthcare
CareInTouch
CareInTouch is a Bay Area home health agency providing skilled nursing and therapy services to patients referred from hospitals and clinics. With over 100 staff, they operate in one of the most complex and compliance-driven healthcare markets in the country.- 40% Reduction In Billing Errors
- 100+Staff Operations Managed
- 0Missed Compliance Deadlines

- Startup
Sparkle The Cleaning Service
Sparkle The Cleaning Service is a Detroit-area residential cleaning company with 10 years in business, connecting homeowners with vetted, insured independent cleaners through a subscription-based marketplace platform.- 75% Platform Transparency
- 2XPlatform Growth
- 40%Higher User Retention

- Startup
DineMate
DineMate is a Maryland-based dating and connecting platform built around verified profiles, restaurant reservations, and prepaid dining experiences. Founded to bring back authenticity to how people meet and connect.- 60% Time Saved
- 99%System Reliability
- 40%Higher User Retention

- Healthcare
Prior Authorization AI
Prior Authorization AI is a healthcare automation startup building AI-powered tools to streamline prior authorization for Medicare and Medicaid medical transportation providers in New Jersey.- 16Weekly hours saved
- 63%Admin time reduced
- 43%Fewer submission errors

- Education
Grand Central Language Services
Grand Central Language Services provides translation and interpretation for organizations operating in complex, multilingual environments. As demand grew, internal workflows became harder to manage. SoftDoes built a custom platform to streamline coordination, improve visibility, and support scalable operations.- 72%Workflow Reduction
- 48%Coordination Reduction
- 83%Visibility Increase

- Healthcare
FMY Orthodontics
FMY Orthodontics, a multi-location practice in West Tennessee, partnered with SoftDoes to replace a spreadsheet-based financial workflow with a custom web platform. The goal was to simplify how staff present treatment financing while allowing patients and families to review and complete decisions remotely.- 60%Workflow Reduction
- 75%Remote Adoption
- 5Locations Aligned

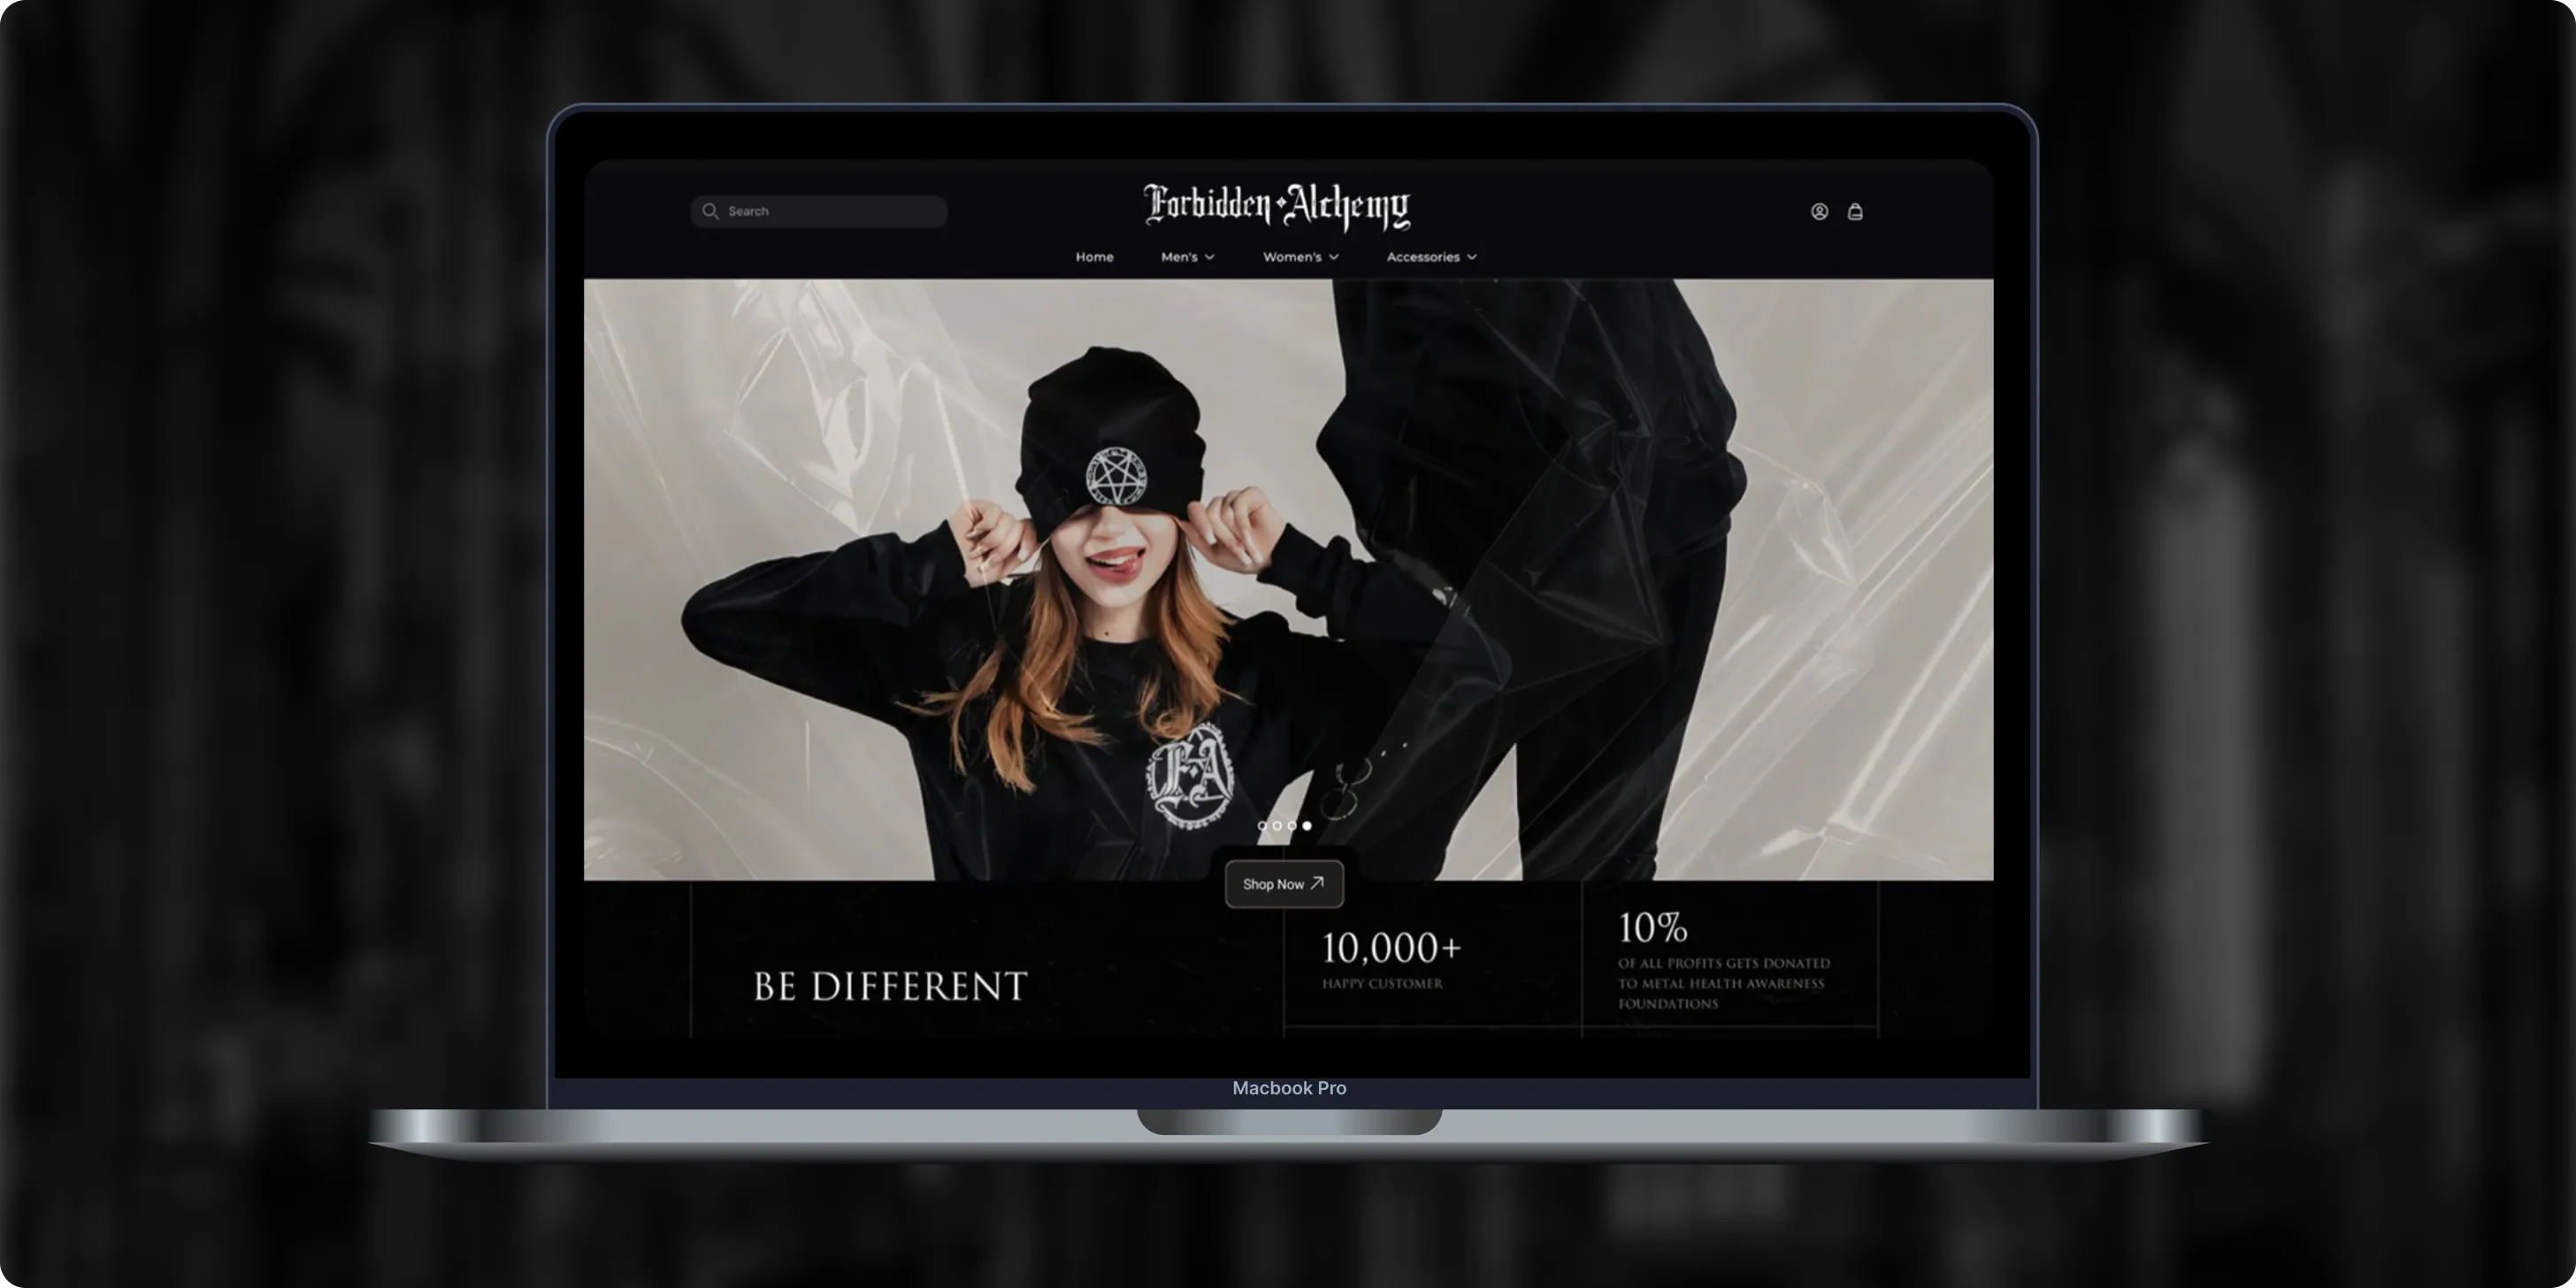
Forbidden Alchemy
Forbidden Alchemy is an alternative fashion brand creating dark, provocative clothing for the metalhead community, with 10% of profits donated to mental health awareness. Its mostly mobile audience struggled with a store that was hard to navigate and weak on functionality.- +44%Revenue Month Over Month
- 86%Design Satisfaction
- 2.8XUser Retention Growth
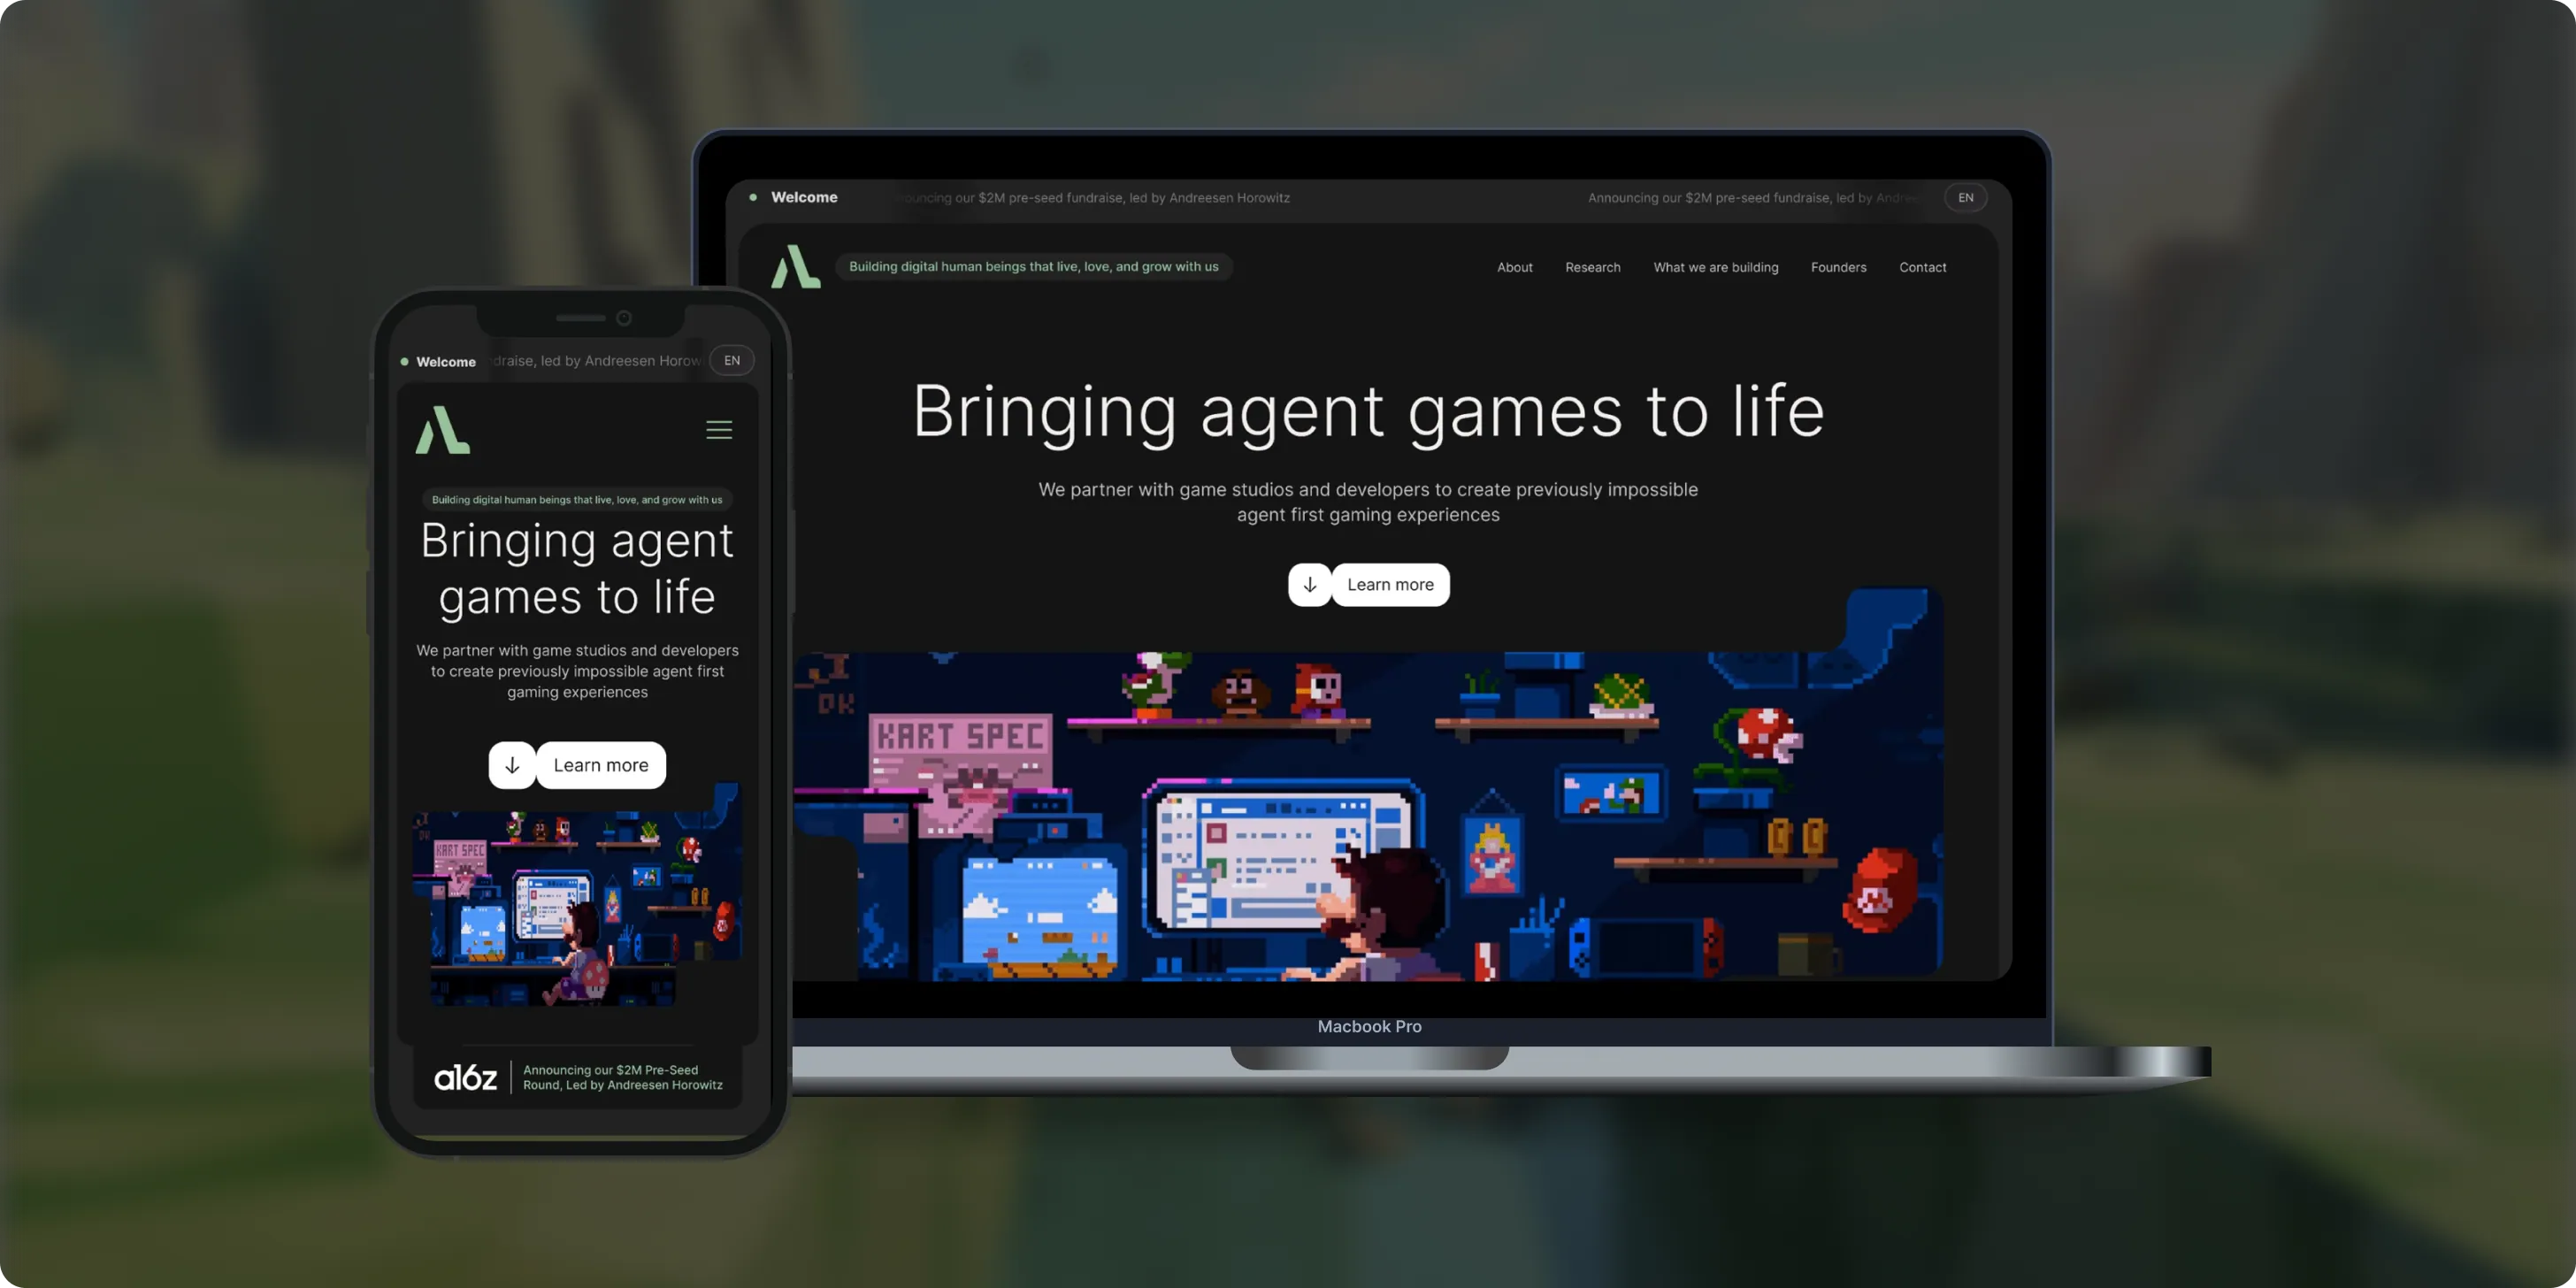
Altera
Altera builds on decades of computational neuroscience research to create digital human beings for gaming. Backed by a $2M pre-seed round led by Andreessen Horowitz, the team needed a landing page that could explain complex agent technology to players, partners, and investors.- 98%Dynamic Customization
- 100%Streamlined Navigation
- $2MPre-Seed Round
- Real Estate
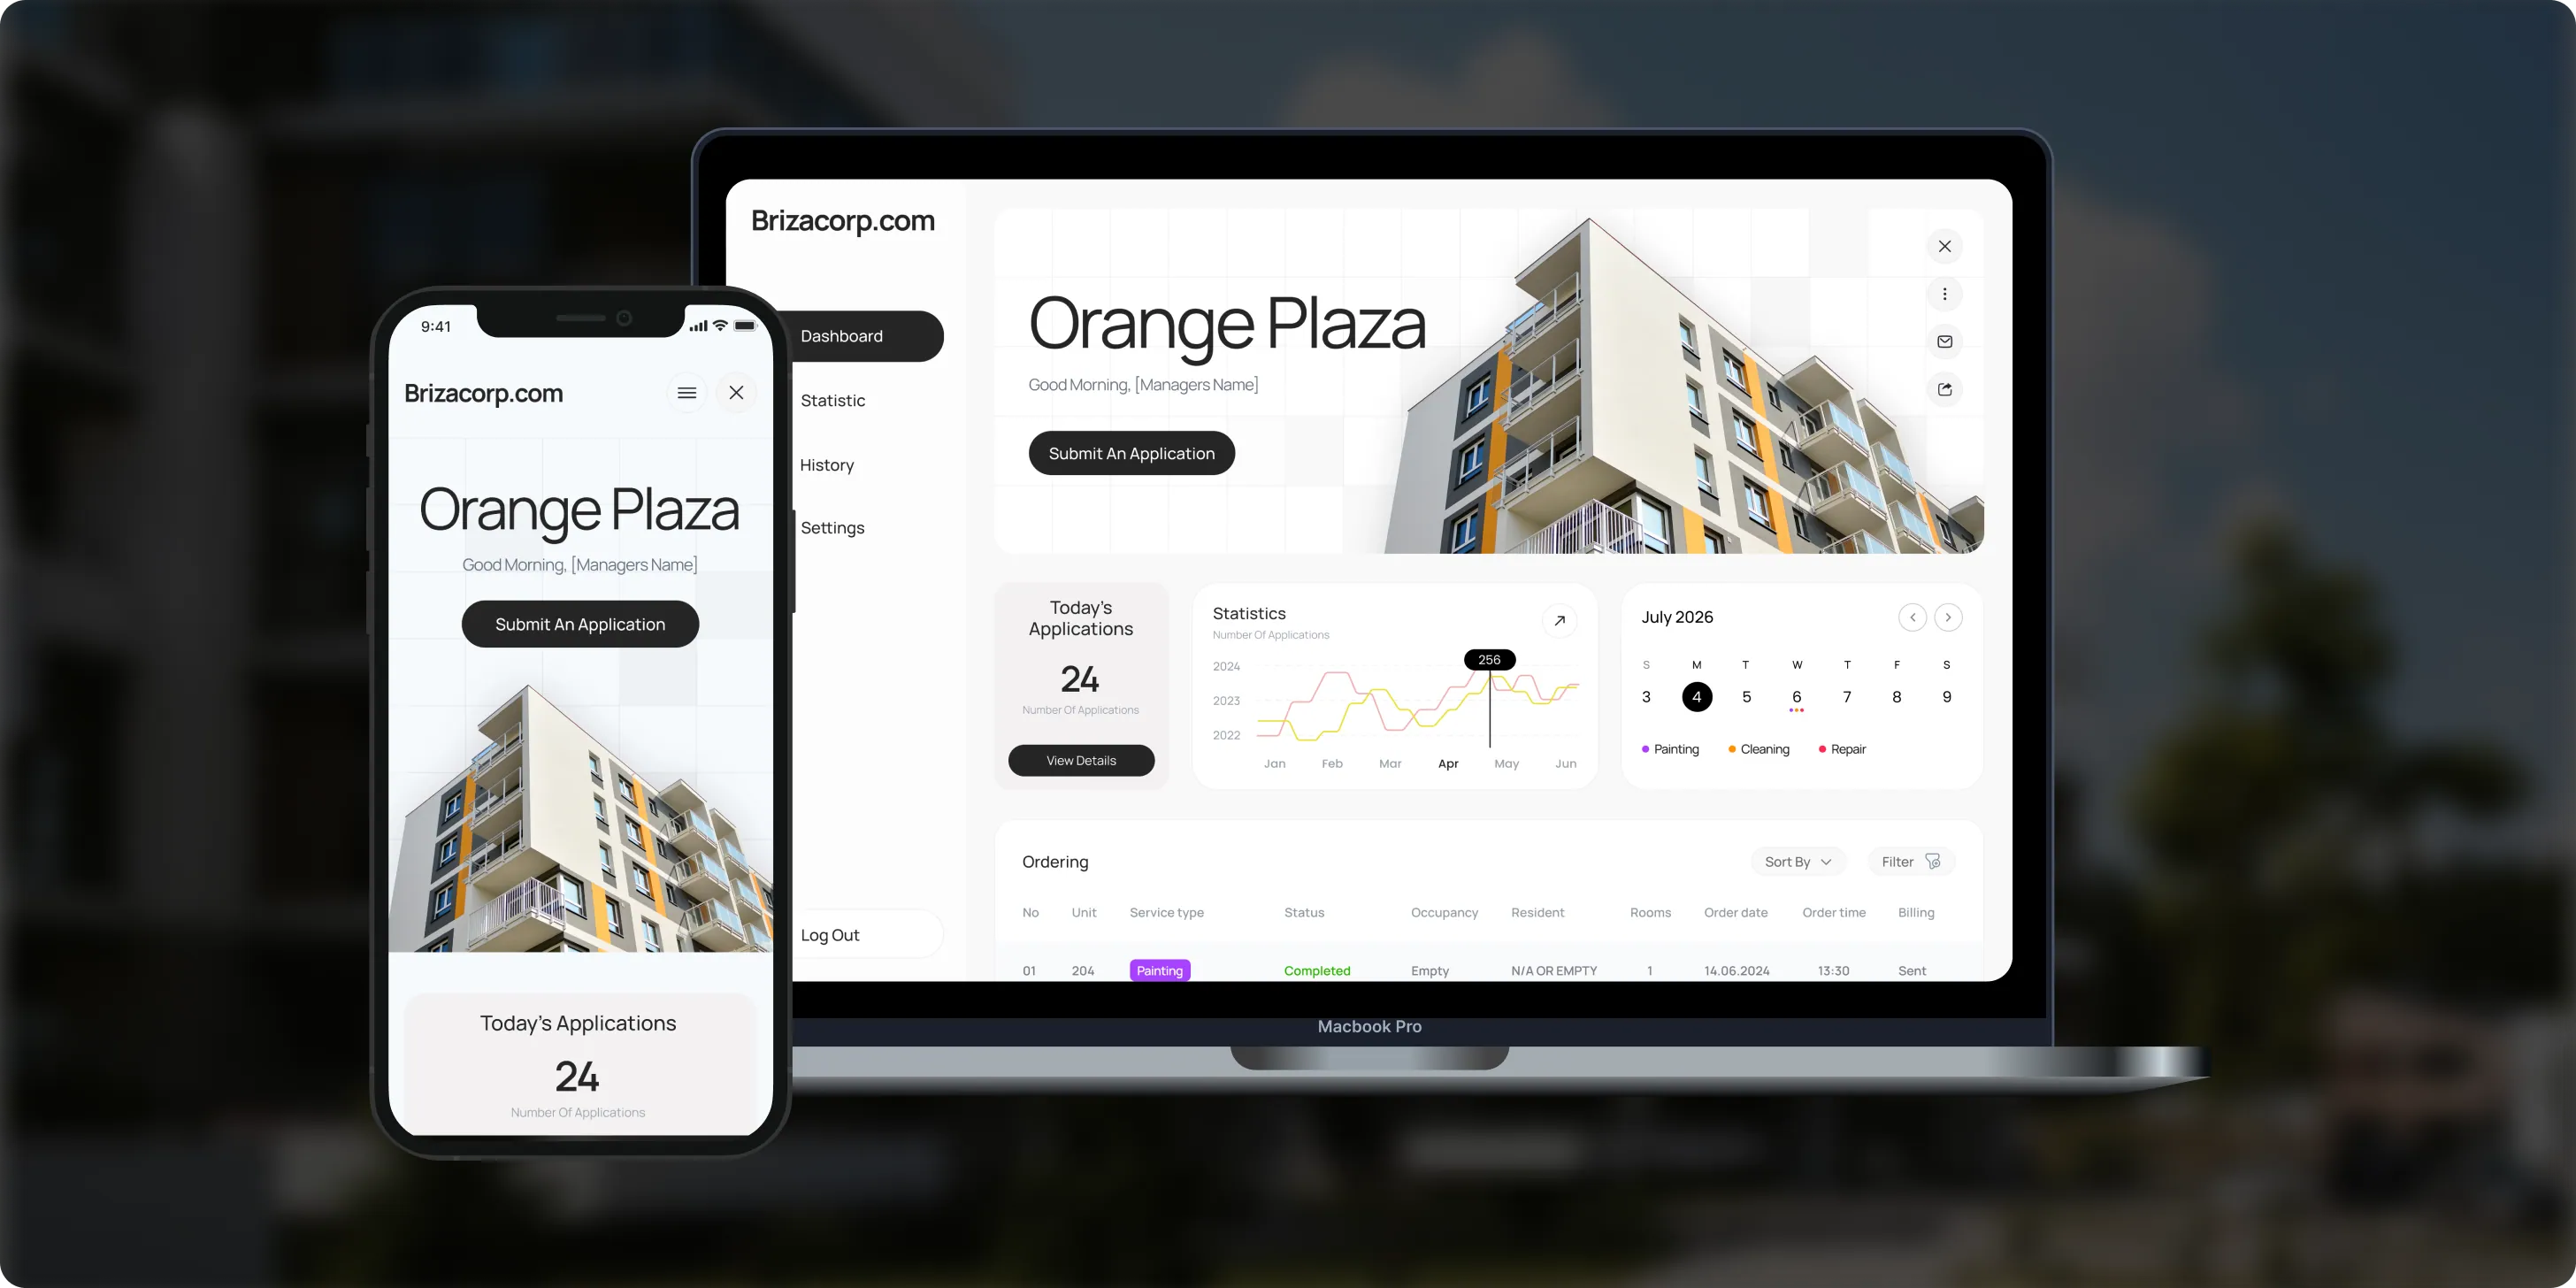
Brizacorp
Brizacorp manages residential properties and coordinates the staff who handle painting, cleaning, and repair requests. Its team tracked work across messengers, phone calls, e-mail, and paper planners, with no single place to manage requests or measure performance.- 98%Application Stability
- 95%Utilization Rate
- 30%Faster Task Completion
Color & Harmony
Color & Harmony is a Kentucky-based color consulting studio led by certified color strategist Diana Cartaya. The studio needed a website that reflects its refined aesthetic, showcases its portfolio, and explains a science-based color process in simple language.- 45%Conversion Rate Increase
- 50%Higher User Engagement
- 2Months to Launch

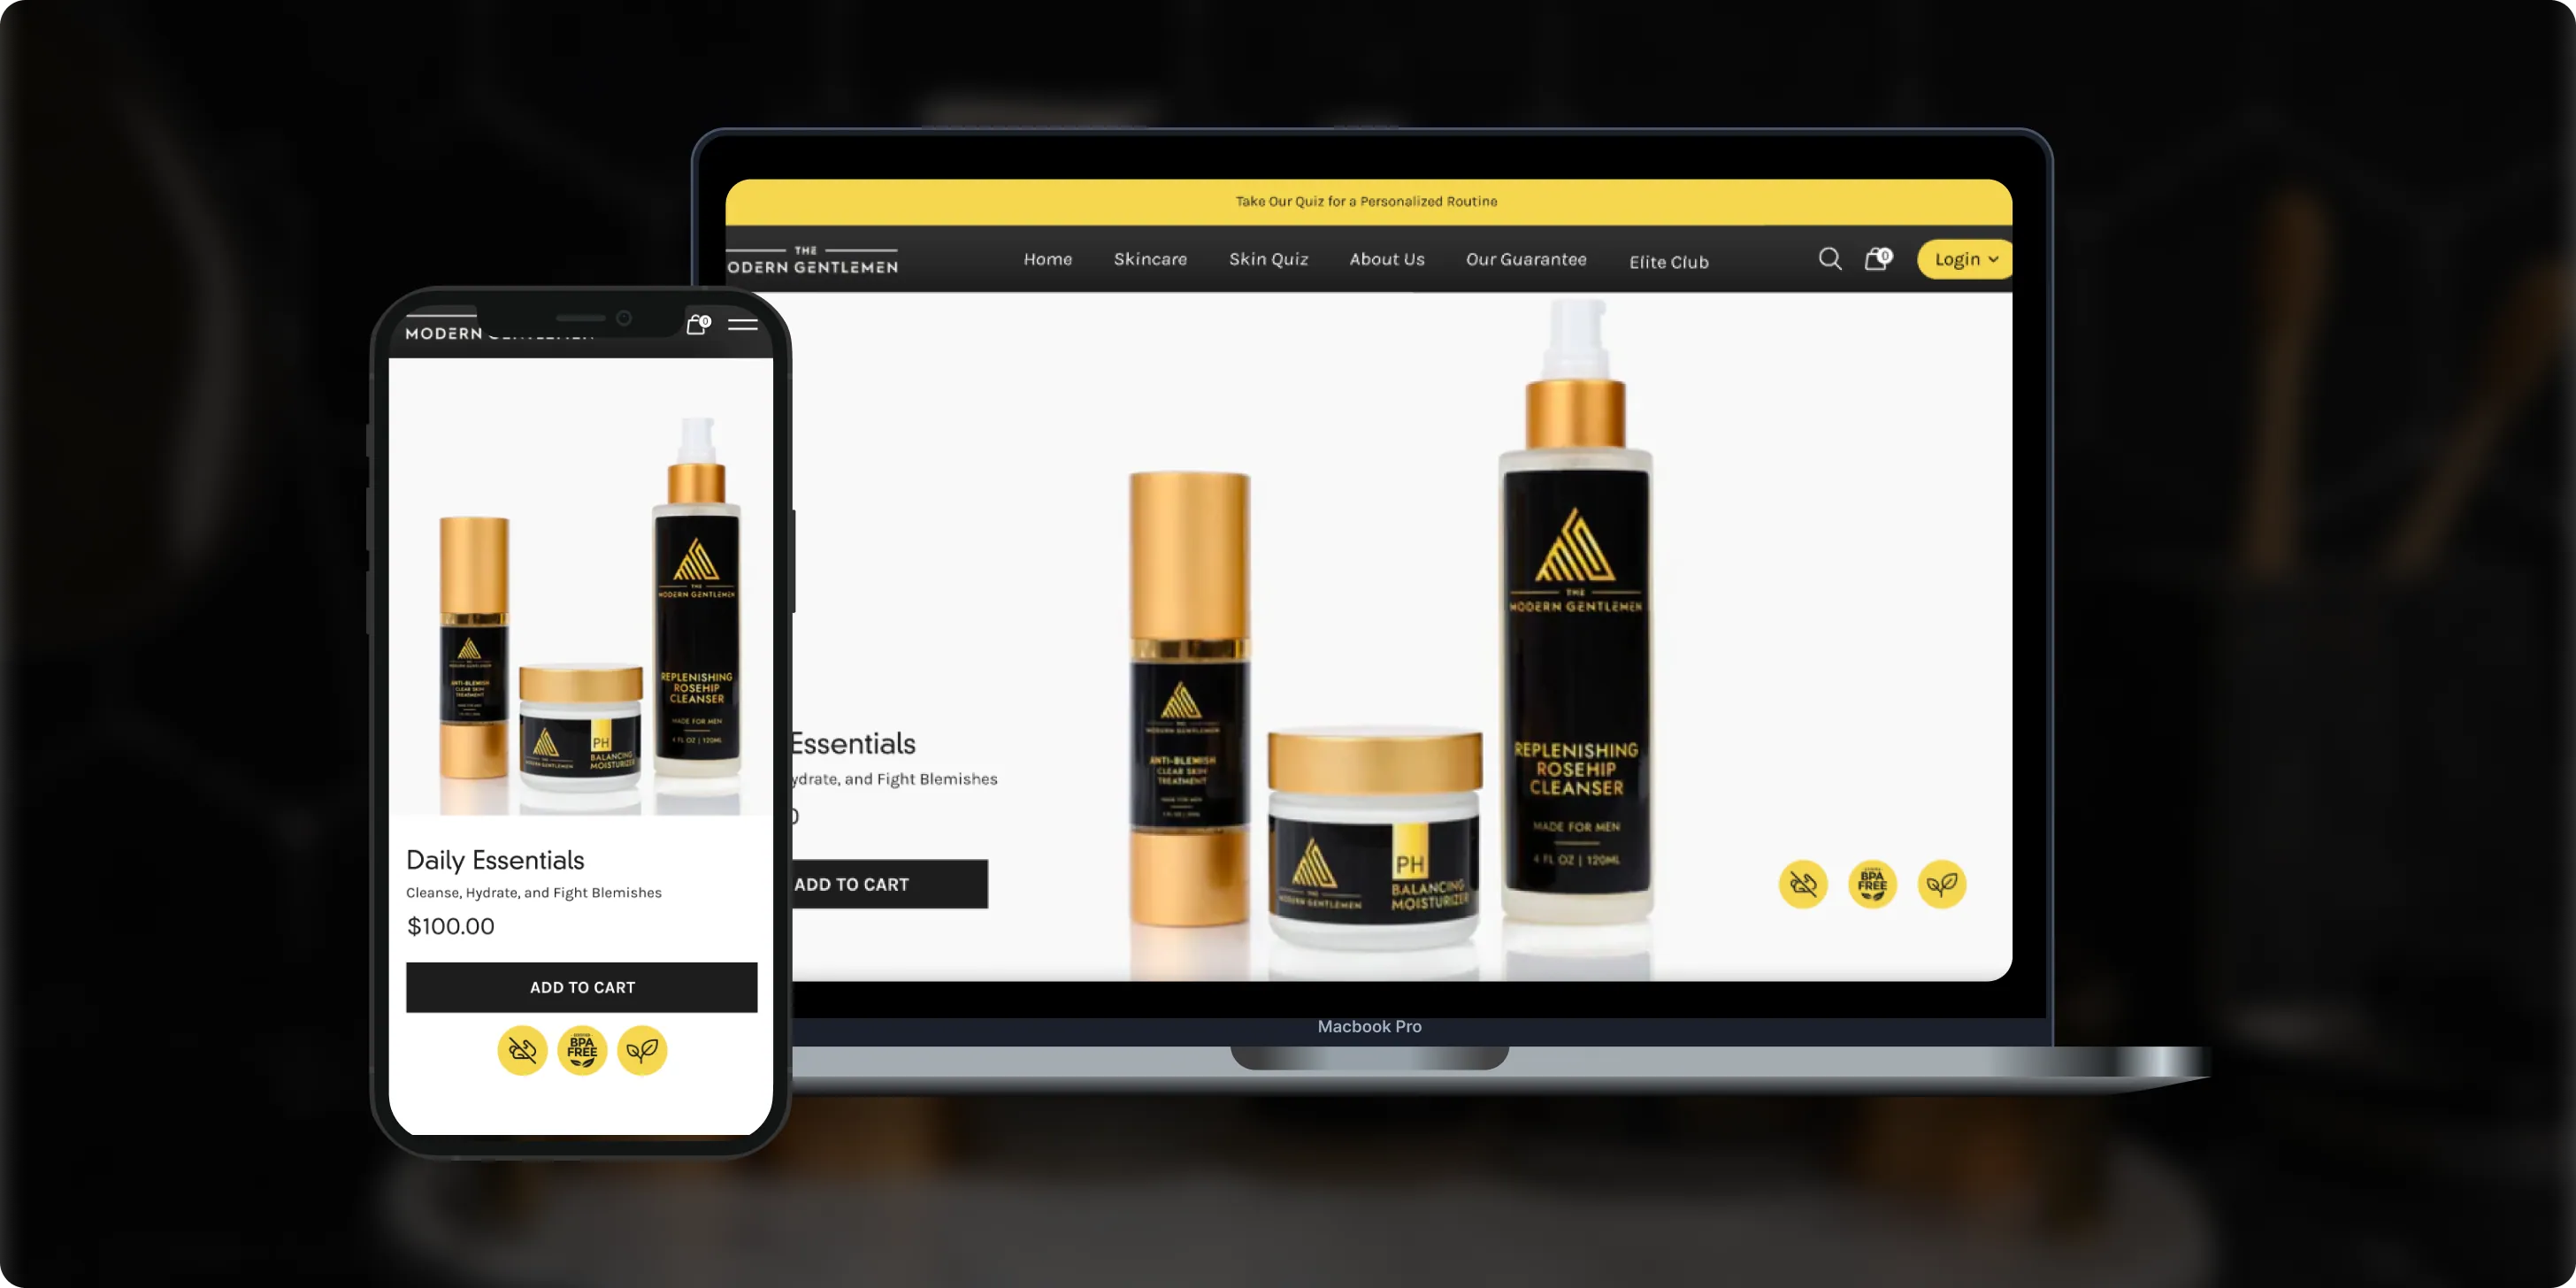
The Modern Gentlemen
The Modern Gentlemen sells premium men's skincare featured in Men's Health, GQ, and Men's Journal. Its customers wanted an efficient routine, but generic product suggestions and limited skincare knowledge made choosing the right products hard.- 30%Increase in Conversions
- 25%Higher Customer Retention
- 92%Mobile Purchases
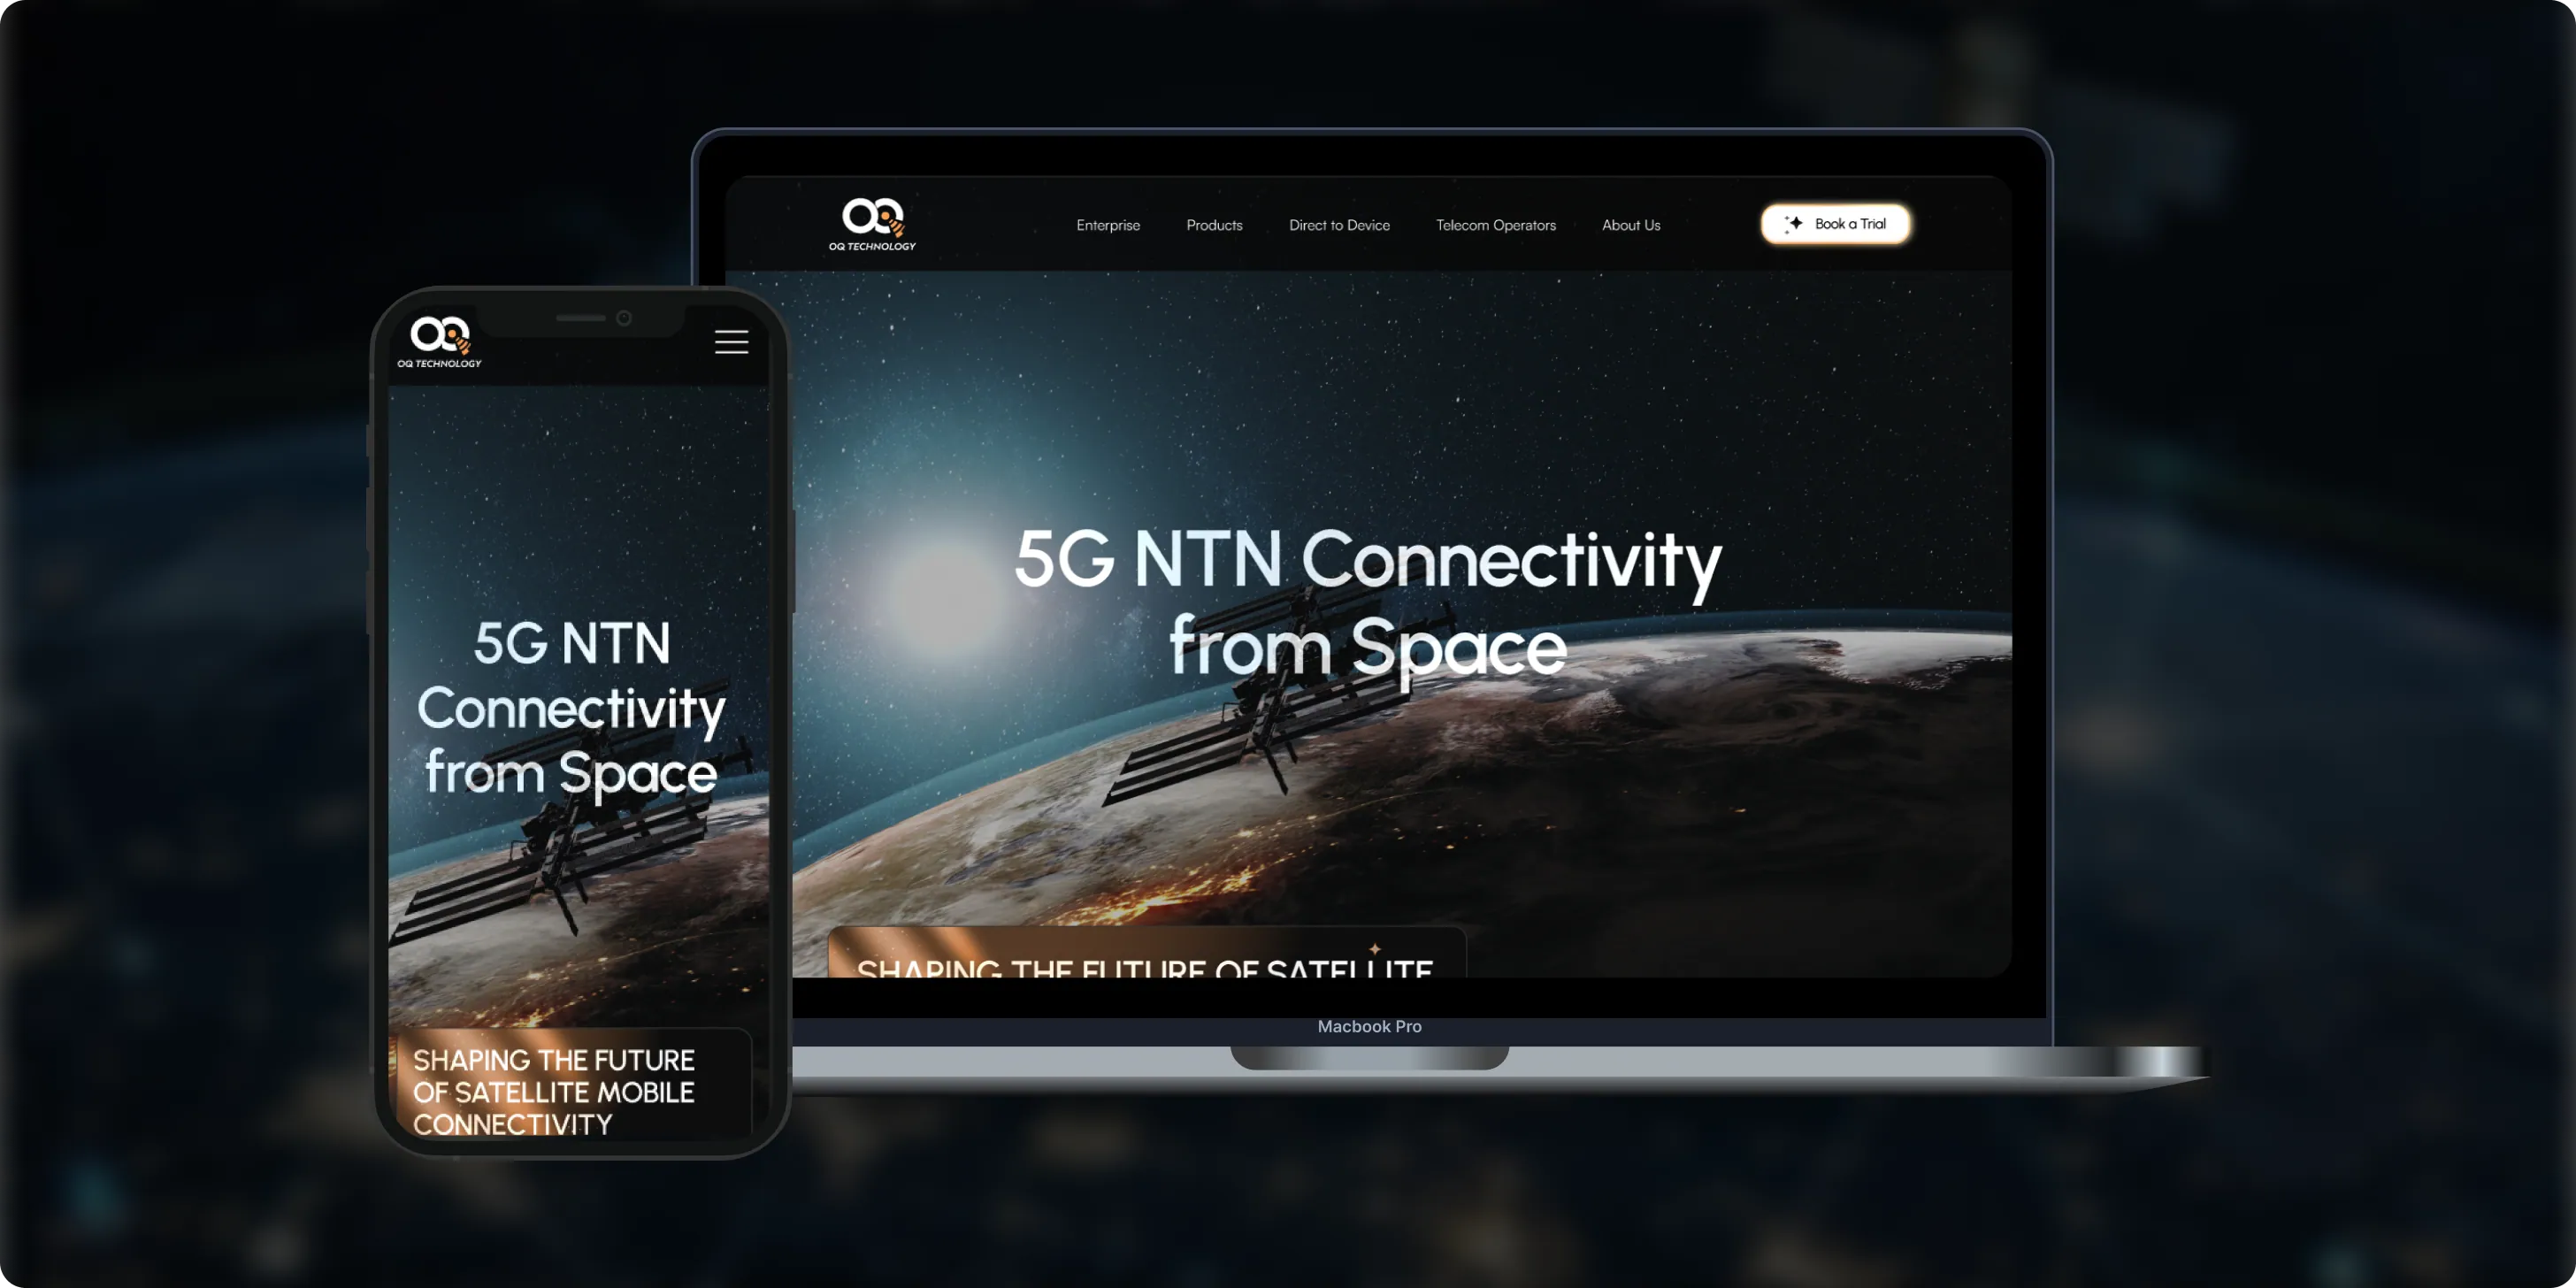
OQ Technology
OQ Technology connects IoT devices, machines, and people anywhere on the planet through its satellite network, serving energy, maritime, logistics, agriculture, and mobile operators. Its website made it hard to explore products and reach pricing plans.- 4Pricing Plans Clarified
- 3Dedicated User Flows
- 1Unified Platform
- Real Estate
- Finance
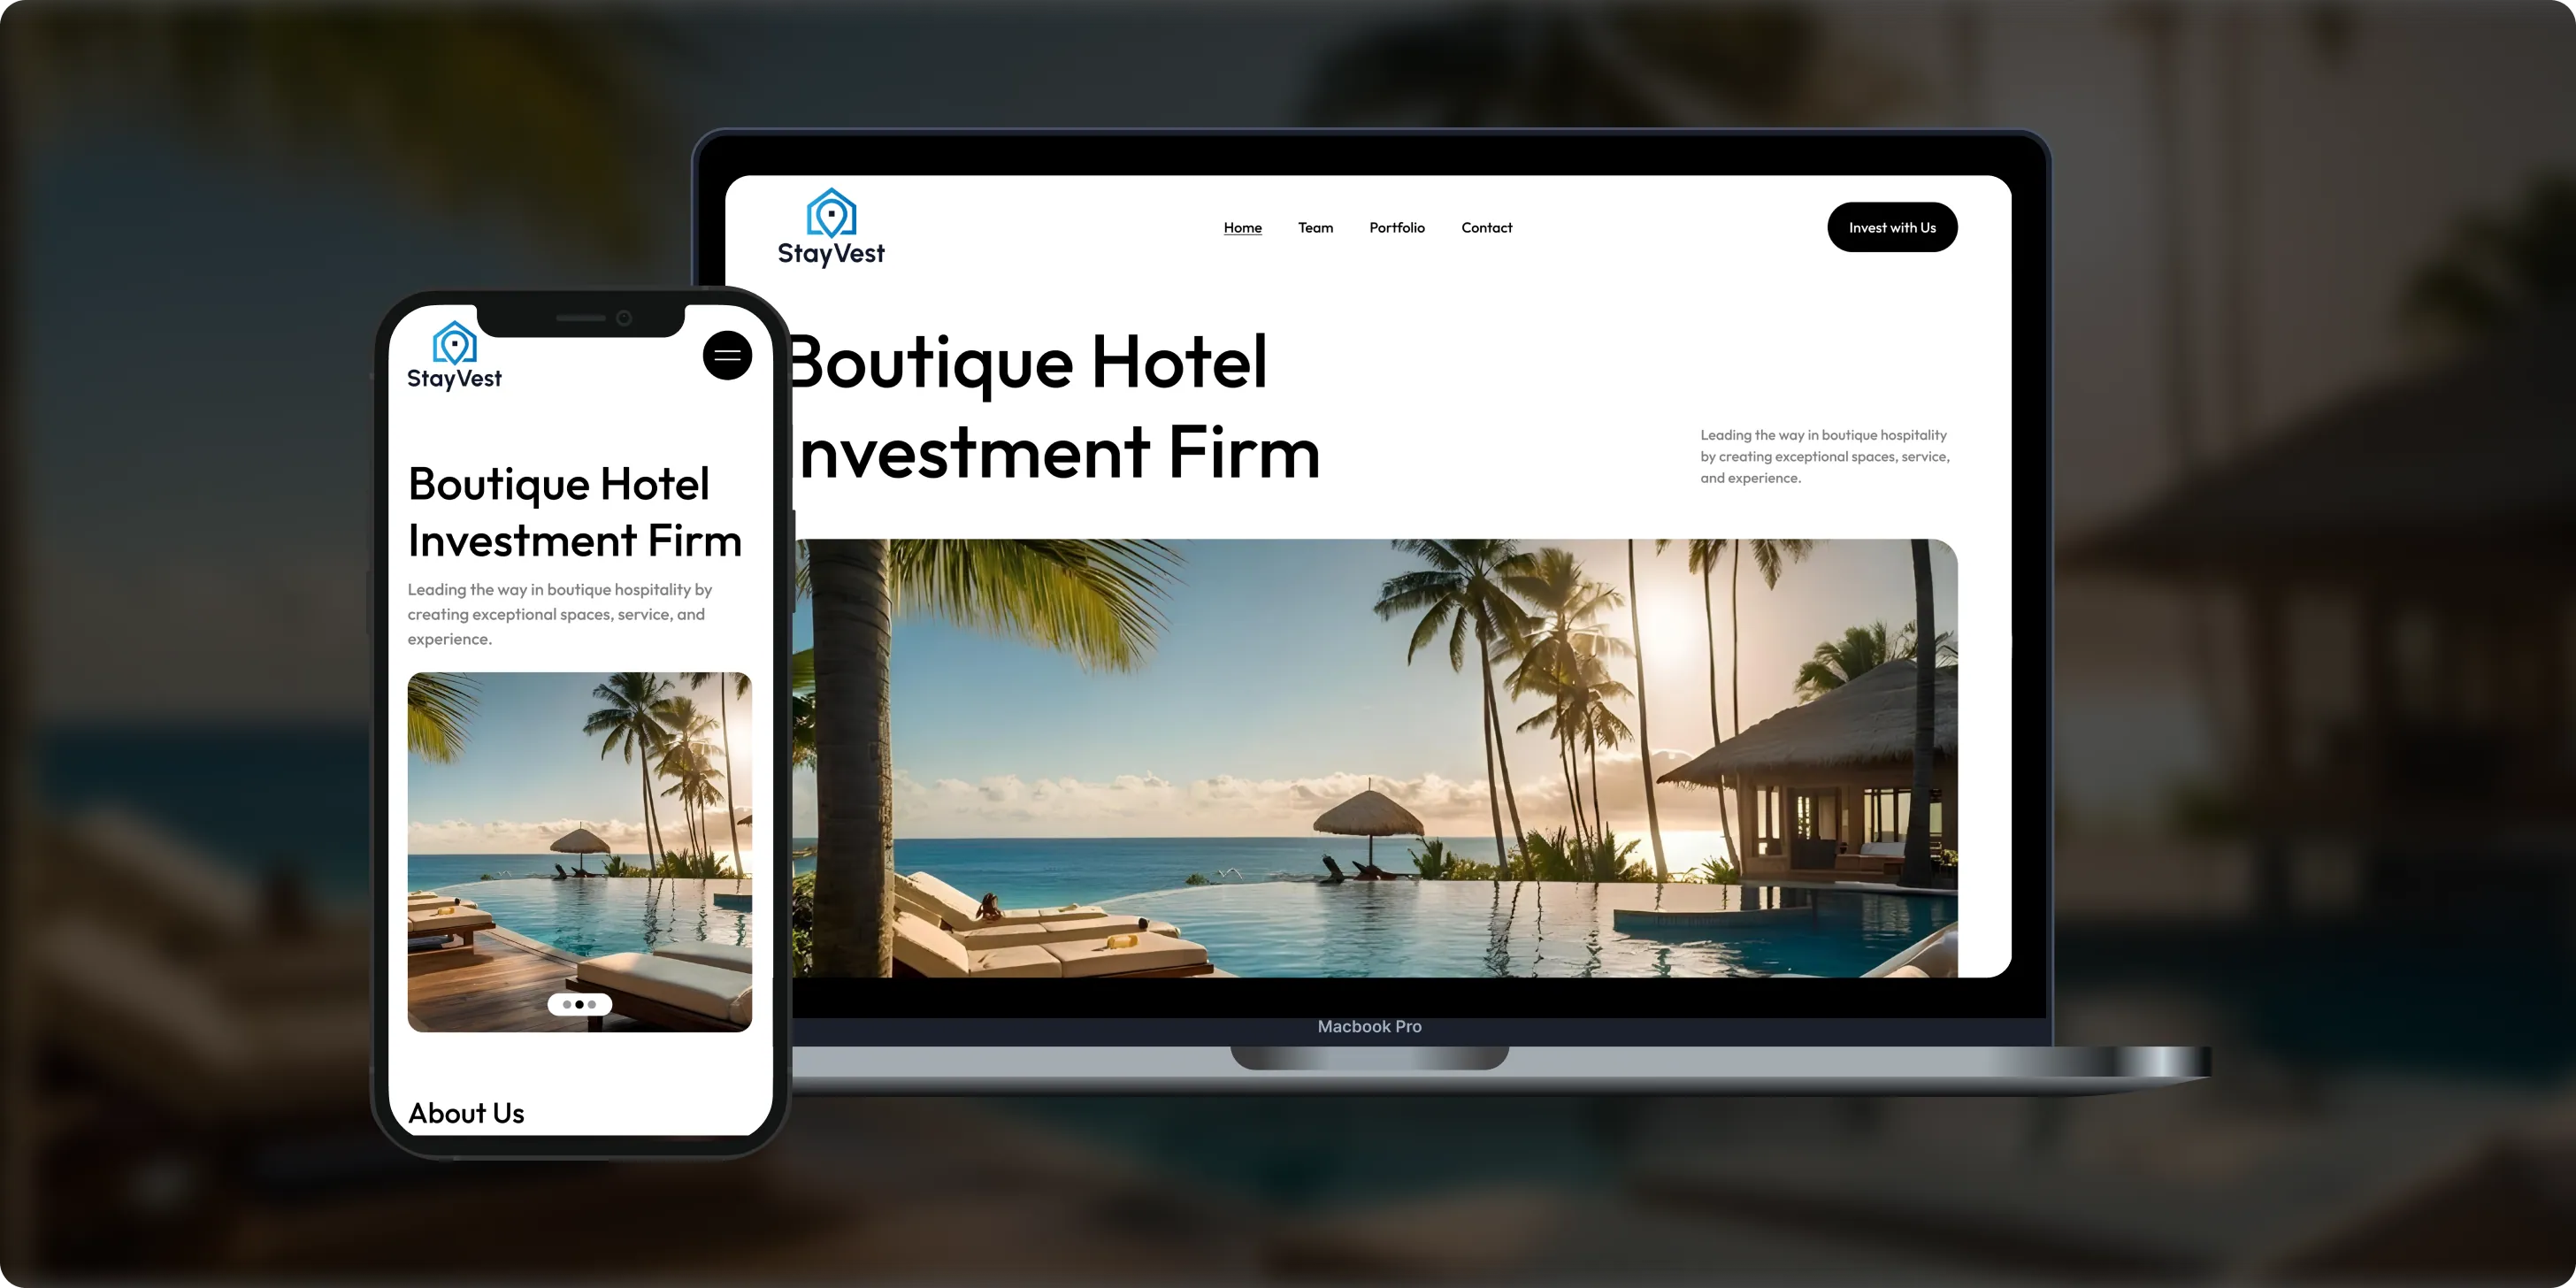
Stay Vest
Stay Vest is a private real estate investment firm that acquires, renovates, and operates boutique hotels for cash flow, tax benefits, and equity gain. It needed a platform that explains its strategy and earns the trust of passive investors.- 1,500+Guest Stays
- 200+Rooms Managed
- 5States Covered
Bokeyno Motorsports
Bokeyno Motorsports is the leading mobile installer of vertical doors for high-performance cars. This Shopify website isn’t just about services—it’s a bold statement of power, style, and expertise. With a sharp layout, strong visuals, and real-world case studies, the site delivers all the information car enthusiasts need to book confidently and instantly.- 54%Booking Requests
- 43%Lead Conversion
- 32%Qualified Inquiries

ai document processing platform
A comprehensive talent solution designed to help companies attract, hire, and retain top talent more effectively. The platform combines AI-powered recruitment technology with employee financial wellbeing programs, enabling smarter hiring decisions while supporting employees’ financial stability and long-term engagement.- 62%Faster Processing Time
- 78%Less Manual Work
- 35%Improved Accuracy

WHAT CLIENTS SAY
Independently verified reviews from real clients on Clutch.co


Client Story
Real feedback from
FMY Orthodontics

“SoftDoes consistently found ways to make things work, added features we had not originally envisioned, and never became frustrated. It felt like working with a true partner who cared about the success of our practice.”
Dan Merwin
DDS, MS, President, FMY Orthodontics

Client Story
Real feedback from
Prior Authorization AI
“Every time I sent a request, if there was anything that didn't work, they were able to turn it around quickly. Even when there were no updates yet, they always reached out to let me know they were working on it.”
Joseph Oluwo
Founder of Prior Authorization AI


Client Story
Real feedback from
WOVEN
“What stood out most was their commitment to understanding our needs before presenting solutions.”
Danna Pastran
Administrative Operations Manager, WOVEN

Client Story
Real feedback from
Grand Central Language Services
“The site performs as intended and provides the foundation for our company's digital presence.”
Joe Goldstein
QA Manager, Grand Central Language Services


Client Story
Real feedback from
DineMate
“They go above and beyond.”
Eric Snead
CEO, DineMate "Dating Connecting Platform"
WHAT CHANGED IN PRACTICE
Clients didn’t stay because of promises. They stayed because delivery became predictable, ownership was clear, and the product kept moving forward after launch.
- 01Direct Access to Senior Engineers
SoftDoes puts experienced engineers and architects directly in contact with Cambridge stakeholders. No routing through project managers who summarize and lose detail. This shortens feedback loops, clarifies requirements, and helps turn business analytics needs into working solutions faster. Our senior staff discuss data analysis details, system constraints, and business objectives in the same conversation. This reduces misunderstandings when designing analytics architectures, dashboards, or data pipelines. Whether the topic is a complex data warehouse migration or a new set of BI tools, the person doing the work is the person in the room. Traditional models rely on many communication layers. We do not.
- 02Predictable Delivery
SoftDoes plans analytics and software work in clearly defined scopes, with visible progress and frequent checkpoints. We use metrics from previous projects and ongoing data from current work to forecast effort and timelines accurately. Our teams share short, focused updates with Cambridge clients: what was completed, what decisions are needed next, and where risks sit. This predictability helps organizations coordinate releases, communication, and internal training around new analytics capabilities. Business analytics roadmaps and transparent backlog management are standard practice, and when new data shifts priorities, we adapt without losing control over the overall direction.
- 03Built to Last Past Launch
SoftDoes designs analytics systems, data models, and dashboards that remain understandable and maintainable long after the initial release. We practice clear naming, documentation of KPIs, data lineage tracking, and robust testing for pipelines and reports. This mindset avoids fragile solutions that break under new data volumes or additional business questions. Cambridge teams receive handover materials, training sessions, and guidance on extending the analytics setup safely. Cost savings from avoiding repeated rework and patching around poorly structured data are significant. A sustainable data driven culture depends on analytics infrastructure that lasts, not one off dashboards that decay within months.
- 04No Babysitting Required
SoftDoes operates with minimal hand holding. We proactively identify issues, risks, and opportunities in analytics projects before they surface as problems. Our teams monitor data pipelines, dashboard usage, and error signals so improvements happen before escalation. Regular but concise check ins let Cambridge stakeholders review progress and decisions without micro managing day to day tasks. This frees internal teams to focus on strategy and operations. Automatic alerts for failing jobs or missing data sources are part of standard business intelligence operations. Autonomy does not mean opacity: clients retain full visibility into code, data models, and analytics configurations at all times.
Technologies We Use

 Microsoft
 Salesforce
 SAP
 Atlassian
 Jira
 Trello
 Asana
 Monday.com
 ServiceNow
 Workday
 NetSuite
 Zendesk
 HubSpot























Frequently Asked Questions
Everything you need to know about working with SoftDoes. Can’t find an answer?
What is business intelligence?
Business intelligence is the process of collecting, organizing and analyzing company data so people can make better decisions. It includes data warehouses, reports and dashboards that show trends in sales, costs and operations. Cambridge companies, from startups to research groups, use it to replace scattered spreadsheets. See our business analytics services.
What is the reporting layer of a data warehouse?
The reporting layer of a data warehouse is the top tier where cleaned data is shaped into tables, views and metrics that dashboards and reports read. It hides raw complexity and keeps definitions like revenue or active users consistent. Cambridge analytics teams depend on it for trusted numbers. Learn more about our business analytics work.
What is a business intelligence strategy, and how do you build one?
A business intelligence strategy is a plan for which decisions data should support, which sources feed it, which tools to use and who owns each metric. Build one by interviewing leaders, listing key questions, auditing data quality and rolling out dashboards in phases. Cambridge companies should start with a few metrics. See our business analytics services.
How much does Power BI consulting cost per hour?
Power BI consulting rates vary with the consultant's experience, project complexity and whether work is billed hourly or as a fixed project. Data modeling and complex integrations cost more than simple report builds. Ask consultants for current rates and a written scope. Cambridge companies can compare against a fixed-price project through our business analytics services.
How would the technology industry use business intelligence?
The technology industry uses business intelligence to track product usage, subscription revenue, churn, customer acquisition costs and support load. Dashboards help product teams see which features people use and help sales forecast deals. Cambridge software startups use it to report to investors. A reporting dashboard starts from $7,000 at SoftDoes. Explore our business analytics work.
How do healthcare companies in Cambridge use BI dashboards?
Healthcare companies in Cambridge use BI dashboards to track clinical trial progress, lab output, patient volumes and research spending. Biotech teams around Kendall Square watch study timelines and supply use in one place. Dashboards with patient data need HIPAA access controls. Read about our healthcare software development.
What should an education provider in Cambridge budget for business analytics?
A Cambridge education provider should budget for business analytics based on its data sources, such as student information and learning systems, and the number of dashboards needed. A reporting dashboard starts from $7,000 at SoftDoes, and connecting two systems from $3,000. Student data reporting must respect FERPA. See our education software development.
How to Build Utility Billing Software: A Practical Guide for U.S. and Canadian Utilities
Energy
Game Platform Development: Building Scalable, Profitable Ecosystems in 2026
Web development
Game platform development is where studios and enterprises build the shared backend, tools, stores, and analytics that power not just one game but many. This article covers the strategy, software architecture, core modules, engine choices, and phased roadmap you need to launch or upgrade a game platform in the U.S. or Canadian market.
GTA 6 Programming Language: How Rockstar Builds Its Next Gen Open World
Web development
The energy sector is going through one of the most significant technology shifts in decades. Utilities are modernizing legacy systems, renewable developers need smarter forecasting tools, and grid operators face growing pressure to manage distributed energy resources at scale. With the energy software market projected to exceed $50 billion by 2027, choosing the right development partner matters more than ever. This guide breaks down the top energy software development companies serving U.S. and Canadian organizations in 2026 and helps you match the right vendor to your specific needs.